
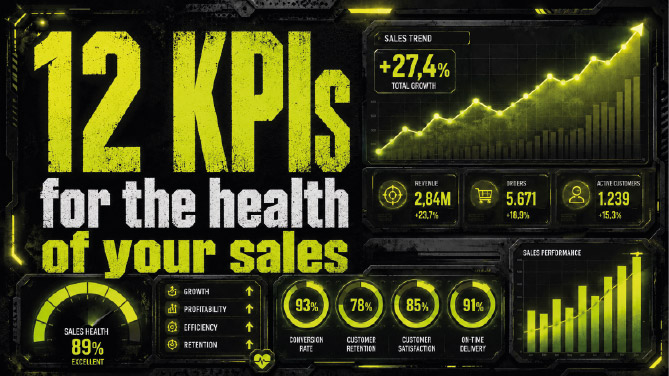
Ask a sales director how sales are going and in most cases they'll answer with a number: revenue for the period, compared to the previous year.
It's the most intuitive indicator. And it's also the most delayed.
Revenue is an outcome indicator, not a process indicator. It tells you what has already happened, not what's about to happen. By the time it starts dropping, the problems that caused it have been underway for months: customers who have slowed down, product lines that are no longer being proposed, a competitor that has gained ground in a certain area.
The KPIs that really matter are the ones that warn you in advance.
The basic KPIs: the level everyone should have
1. Revenue by period, with year-over-year comparison.
The starting point, but it needs to be read carefully: always compare homogeneous periods and strip out the effect of exceptional events (an extraordinary order, a lost customer, an acquisition). The raw figure lies more often than you'd think.
2. Average margin per order.
Revenue without margin is an empty number. A 10% increase in revenue with a 15% reduction in margin is a worsening, not an improvement. Always monitor the two metrics together.
3. Average order value.
How much an order is worth on average. If it grows, you're selling better. If it drops while revenue rises, it means you're working harder for the same result.
4. Purchase frequency.
How often a customer orders on average. It's one of the most predictive metrics: a drop in frequency almost always precedes a drop in revenue, by weeks or months.
Portfolio KPIs: where the truth is hidden
5. Revenue concentration.
How much do your top 5, 10, 20 customers weigh on the total? If your top three customers account for 60% of revenue, you don't have a solid business: you have three fragile relationships. This metric measures the structural risk of your portfolio.
6. Dormant customer reactivation rate.
How many customers in your database have ordered in the last 12 months? The gap between registered customers and active customers is often enormous and represents the cheapest recovery pool that exists. Reactivating an existing customer costs a fraction of what it costs to acquire a new one.
7. Churn rate.
How many customers have stopped ordering compared to the previous period? A 15% annual churn means you have to acquire 15% new customers just to stand still. It's one of the most underrated metrics in B2B.
8. Customer Lifetime Value.
How much a customer is worth on average over the entire duration of the commercial relationship. It's the metric that tells you how much you can afford to invest to acquire and retain them. Without this figure, every marketing budget decision is a leap in the dark.
Product KPIs: understanding what you're really selling
9. Product mix per customer.
How many different product references does each customer buy on average? A customer who buys three references is much more stable than one who buys just one. And every additional reference drastically reduces the likelihood of them switching to a competitor.
10. Premium line penetration.
How many customers buy your high-margin products? This metric is the thermometer of your sales network's effectiveness: if premium lines stay flat while base products fly off the shelves, the problem isn't the market. It's that no one is proposing them.
11. Inventory turnover at the customer level.
How quickly the customer resells what they've bought. It's a metric few monitor but it's decisive in the distribution chain: a customer with slow turnover will stop ordering, regardless of how good the commercial relationship is.
12. Catalog coverage.
What percentage of your catalog is actually being sold? If 70% of revenue comes from 15% of your references, you have a product knowledge problem along the chain, not a catalog problem.
The chapter almost no one addresses: distribution chain KPIs
Here we come to the hardest part for those who sell through wholesalers and distributors.
The structural problem is well known: the manufacturing company knows the sell-in, meaning how much it sells to its wholesalers, but rarely knows the sell-out, meaning how much those wholesalers actually resell to end customers.
It's a difference that completely changes how the data reads.
Sell-in / sell-out ratio.
If you sell 100 units to the wholesaler and they resell 60, you have 40 units sitting in the warehouse. Your revenue says you're growing, but the real market is absorbing less than you're pushing. Sooner or later that warehouse will become a bottleneck and orders will stop.
Average turnover per wholesaler.
How long each distributor takes to clear the stock they've purchased. A wholesaler with fast turnover is a healthy partner. A wholesaler with slow turnover is accumulating a problem that will become yours.
End-customer coverage per wholesaler.
How many end customers does each distributor actually serve with your products? A wholesaler that buys a lot but resells to very few customers is a concentrated risk: if they lose those customers, you lose the entire channel.
Penetration by geographic area.
Comparing performance across similar areas reveals anomalies worth paying attention to: a zone selling half of what an area with equivalent demographic characteristics sells is signaling a network problem, not a market problem.
Performance by wholesaler salesperson.
The hardest metric to obtain and the most valuable. Which of your distributors' salespeople actively propose your products and which don't? Without a structured incentive program that maps the indirect network, this data simply doesn't exist. With that program, it becomes the foundation on which to build every commercial action along the chain.
The metrics everyone watches that are useless
It's worth saying what not to watch, or at least what not to overvalue.
The number of sales visits. Counting visits without measuring their outcome rewards activity, not results. An agent who makes 40 visits without closing anything isn't working better than one who makes 15 with 10 orders.
The number of quotes issued. Same logic. What matters is the conversion rate, not the volume.
Aggregate revenue without segmentation. A total that hides very different performances across areas, product lines, and customer segments is a figure that reassures rather than informs.
The practical problem: how to collect this data
Everything I've listed is technically calculable. The problem is that, in daily practice, almost no one does it.
Not out of incompetence, but for a simple reason: collecting this data manually, updating it frequently enough, and cross-referencing it requires work that no sales team has the time to do. The result is that you always end up looking at revenue, because it's the only figure that arrives on its own.
The difference is made by having a system that collects and updates these metrics automatically, flagging anomalies instead of waiting for someone to look for them. And it's even more decisive along the indirect chain, where sell-out data doesn't exist until you build a mechanism, typically an incentive program, that gives wholesalers' salespeople a concrete reason to share it.
The Salestack AI platform monitors these metrics in real time across the entire network, direct and indirect, and automatically flags situations that require attention: customers slowing down, underperforming areas, premium references never proposed, wholesalers with abnormal turnover.
The question I'll leave you with
Of the twelve metrics I've listed, how many do you monitor with at least monthly updates?
If the answer is "three or four," you're not an exception: you're the norm. But it's exactly in that space, between what you could know and what you really know, that your competitors are building their advantage.
Gianluca Testa
Founder Salestack
Host of the Business Garage Podcast